
Every persistent hacker somehow gets past perimeter security. There could be several mainstream reasons for that such as zero-day exploits, weak authentication, insider threats, misconfigurations, supply chain attacks, etc. Let us imagine one of the possible scenarios that happened. Due to misconfigurations, an attacker gets past through your perimeter defenses. They employ lateral movement tactics to exploit all the resources by crossing over workstations and servers, which will eventually cost your data as well as trust relationships. Most traditional or underperforming SIEM tools flood security teams with a huge number of alerts, which could be for unusual activity, unauthorized process execution, failed login, etc. But determining a pattern and intent seems largely unavailable. You could be reacting to a symptom but unable to stop the attack.
This is a harsh reality for most of the SOC teams out there. Surprisingly, the average time to identify and contain a breach has reached a 7-year low of 258 days in 2024 (Source: IBM Cost of Data Breach Report)
Problem: Legacy tools are essential, but largely struggle to connect the dots across multi-cloud environments and massive databases.
Solution: Entity-Driven Analytics for Threat Detection
Entity-driven analytics of threats is a more efficient form of threat identification and categorization based on the thematic concept of finding a needle-in-a-haystack. It is more likely an exploration, mapping distinct relationships between different kinds of events/entities such as IPs, devices, processes, users, files, etc. Analytics of these connections helps in exploring hideous attack paths and sophisticated attack campaigns that traditional log-centric approaches miss.

In this blog, we will explore the necessity of employing a suitable SIEM (Security Information and Event Management) tool that incorporates entity-driven analytics for threat detection in detail.
What is Entity-Driven Analytics in Threat Detection?
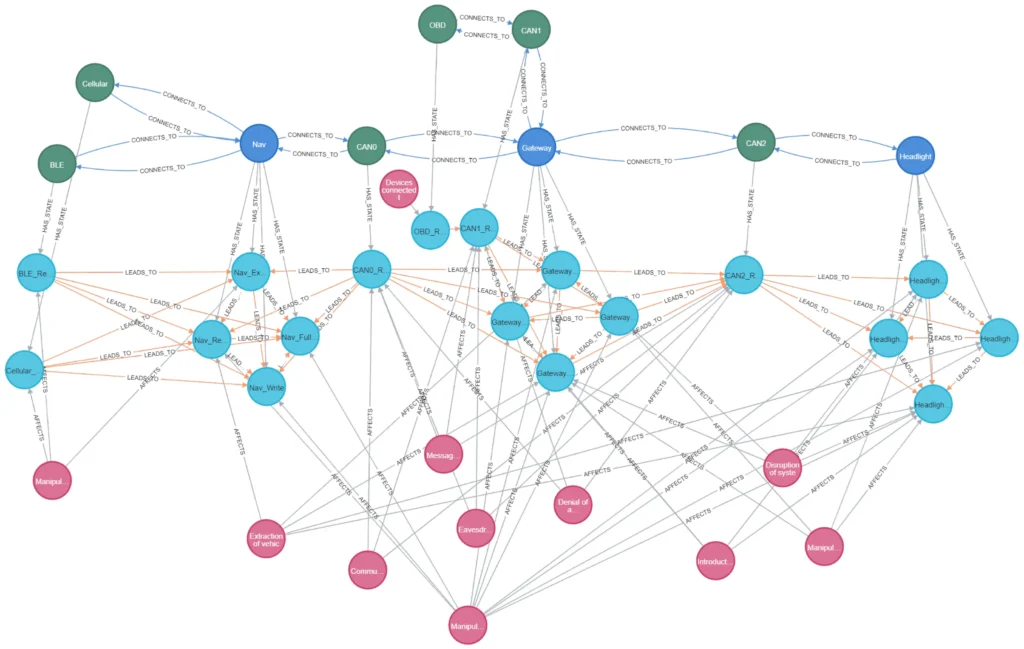
Primarily, entity-driven analytics represents the logs in SIEM as nodes and they are connected through relationships, stated as edges. Let us consider-
Nodes:
- Alert: ‘Brute Force Attempt.’
- Log: ‘RDP Sessions Started.’
- CloudTrail: ‘AssumeRole API Call.’
Edges: Relationships such as,
- Temporal – Event B occurred 10 minutes after Event A from the same IP.
- Casual – Event A (phishing email opened) -> Event B (macro execution) -> Event C (outbound C2 traffic)
- Contextual – Event A (vulnerability scan) and Event B (exploit attempt) targeting the same host occurred.
- Behavioural – Event A (User X deviates from baseline) -> Event B (multiple files downloaded at 3 AM)
Let us understand more by a following scenario-
- Nodes
- Alert: Impossible Travel (User in NY → Login from RU in 5m)
- Log: Sensitive File Access by Same User
- Threat Intel: RU IP Linked to APT29
- Relationships
- Temporal: Impossible Travel → 2m Before → File Access
- Causal: APT29 IP → Likely Associated → Compromised Credentials
| Traditional SIEM | Graph-Driven SIEM |
| Tables/timelines of isolated events. | Interactive maps of event chains and dependencies. |
| Manual correlation (e.g., join queries). | Automated relationship discovery (e.g., “Show all events leading to data exfiltration”). |
| Limited to pre-defined rules. | Reveals novel event patterns via graph traversal. |
Real-World Examples
Tracking APT Lateral Movement
(NotPetya attack, attributed to Russian military intelligence (GRU)).
Event 1: Spear-phishing Email → Event 2: Macro Execution → Event 3: Lateral Movement via RDP → Event 4: Credential Dumping.
Mapping Event Chains in AWS
Capital One Data Breach
Event A: IAM Role Compromise → Event B: Unusual S3 Bucket Access → Event C: Data Exfiltration to External IP.
Insider Threats
Event A: Correlating events like After-Hours Login → Event B: Bulk File Download → Event C: External Upload.
Why Use Entity Analysis for SIEM Threat Detection?
Detecting Lateral Movement

Identifies complex threats by visualizing event sequences—like a brute force attempt followed by a successful login and sensitive file access—revealing the full attack lifecycle rather than isolated alerts.
Reduces Alert Fatigue
Combines related events (e.g., failed MFA → VPN login → unusual data transfer) into a single, coherent attack path, minimizing noise and highlighting genuine threats.
Speeds Up Investigations
Provides context by linking alerts (e.g., malware execution after a vulnerability scan), helping analysts quickly understand attack progression and root causes.
Align with MITRE ATT&CK
Maps events to adversary tactics (e.g., T1110: Brute Force → T1078: Valid Accounts), visualizing technique transitions for better threat intelligence and response alignment.
Optimize Cloud Posture Monitoring
Map complex cloud environments (AWS accounts, VPCs, S3 buckets, IAM roles, instances) to visualize misconfigurations, excessive permissions, and potential attack paths across services and accounts.
Reveals Hidden Connections
Reveal non-obvious relationships between seemingly isolated events or entities (e.g., two compromised machines communicating via an uncommon protocol, both accessing the same obscure file share).
Enhancing Collaboration
Entity analytics is intuitive. SOC analysts, threat hunters, and leadership can quickly grasp complex attack scenarios, fostering better communication and decision-making.
Improves Proactive Hunting
Proactively query the analytics for known bad patterns (e.g., paths to critical assets, unusual service account activity) or use anomaly detection on entity metrics.
Key Components of Entity-Based Threat Detection
Entity Databases
- Neo4j: Optimized for querying event chains (e.g., MATCH (e1)-[:OCCURRED_BEFORE]->(e2)).
- TigerGraph: Handles high-volume event data with low latency.
Visualization Tools
- Maltego: Link events to external threat intel (e.g., IPs tied to C2 feeds).
- Grafana: Timeline-based event chain visualization.
- Linkurious: Explore event graphs interactively.
- CyGraph (MITRE): Open-source tool designed for cybersecurity graph visualization, integrating with MITRE ATT&CK.
Data Sources
- SIEM logs (Splunk, Sentinel, Elastic)
- Firewall & Proxy Logs
- Endpoint Detection and Response (EDR/XDR) Telemetry
- Active Directory Authentication Logs
- Vulnerability Scan Results
- Threat Intelligence Feeds (STIX/TAXII, IoCs)
- Cloud Audit Logs (AWS CloudTrail, Azure AD Audit Logs, GCP Audit Logs)
- Asset Management Databases
Query Languages
// Find brute force → success → data access sequences

MATCH (e1:Event {type: "Failed Login"})-[:OCCURRED_BEFORE]->(e2:Event {type: "Successful Login"})-[:OCCURRED_BEFORE]->(e3:Event {type: "Sensitive File Access"})

WHERE e1.source_ip = e2.source_ip

RETURN e1, e2, e3;
Step-by-Step Guide: Implementing Entity-Driven Threat Detection
Here’s a practical workflow:
Step 1: Data Collection & Ingestion
- Identify and aggregate relevant data sources (logs, flows, telemetry, threat intel).
- Ingest high-value events from:
- SIEM (e.g., Splunk alerts, Sentinel incidents).
- EDR/XDR (process executions, file modifications).
- Cloud logs (e.g., AssumeRole events in AWS).
- Use ETL (Extract, Transform, Load) processes or specialized connectors (e.g., Neo4j Streams, Kafka integrations) to ingest data into your entity database.
- Focus on high-value relationships (logins, network connections, process executions, file accesses, cloud API calls).
Step 2: Building the Graph Model
- Define your Node types: `User`, `Host`, `IPAddress`, `Domain`, `File`, `Process`, `CloudRole`, `S3Bucket`, etc.
{ "type": "Failed Login", "timestamp": "2023-10-01T14:32:00Z", "source_ip": "192.168.1.1" }- Define your Relationship types: `LOGGED_INTO`, `CONNECTED_TO`, `EXECUTED`, `DOWNLOADED`, `OWNS`, `ACCESSED`, `ASSUMED_ROLE`, etc.
{ "type": "OCCURRED_BEFORE", "time_diff": "5m" }- Define Properties: Add attributes to nodes/edges (timestamps, usernames, IP addresses, file hashes, risk scores, cloud regions).
Tip: Align node/edge types with MITRE ATT&CK techniques where possible.
Step 3: Querying for Anomalies
Use your graph query language to hunt for known bad patterns and suspicious relationships.
- Example Neo4j Cypher Query (Hunting for Pass-the-Hash)
 cypher
    MATCH (src:Host)-[r1:LOGGED_INTO]->(comp:Host {compromised: true})
    MATCH (comp)-[r2:LOGGED_INTO,/span>]->(dest:Host)
    WHERE r1.technique = "NTLM" AND r2.technique = "NTLM"
    AND src <> dest
    AND datetime(r1.timestamp) < datetime(r2.timestamp)
    RETURN src, r1, comp, r2, dest;
This finds hosts (`src`) that have logged into a compromised host (`comp`) using NTLM, which then used NTLM to log into another host (`dest`) – a classic PtH indicator.
- Example Gremlin Query (Finding Shortest Path to Critical Asset)
  g.V().has('Host','name','CRITICAL-SERVER-01').inE('ACCESSED').outV()
    .repeat(__.inE('LOGGED_INTO', 'EXECUTED_ON').outV().simplePath())
    .until(has('isExternal', true)).path().by('name').limit(5)
Finds potential paths from external entities to the critical server.
Step 4: Visual Investigation
- Load the query results into your visualization tool.
- Identify Attack Paths: Follow the lines connecting nodes to understand the sequence of compromise.
- Spot Clusters & Anomalies: Look for dense clusters of activity (e.g., many hosts connecting to one external IP) or isolated, unusual nodes/edges.
- Filter & Drill Down: Use filters on properties (timestamp, user, domain, risk score) to focus the view. Expand subgraphs to explore further.
- Leverage Layouts: Use force-directed layouts to naturally reveal clusters, or hierarchical layouts to show parent-child relationships (e.g., cloud account > VPC > subnet > instance).
Step 5: Automating Alerts
- Turn high-fidelity graph queries into proactive detection rules.
- Use a graph database trigger or a scheduled job to run queries periodically.
- Integrate alerts with your SOAR platform or SIEM for automated enrichment and response.
- Example Rule: “Alert if any host communicates with an IP on a known C2 threat feed AND has a direct login path to a Tier-0 asset (Domain Controller).”
Real-World Examples & Case Studies
1. Detecting APT Lateral Movement with Neo4j
- Scenario: A financial institution suspects an APT infiltration.
- Approach: Ingested AD logs, NetFlow, and EDR process data. Built nodes for users, hosts, IPs, processes. Edges for logins, network flows, and process executions.
- Hunt: Queried for hosts exhibiting unusual outbound traffic patterns *and* having recent logins from users associated with high-privilege groups. Visualization revealed a path: a compromised workstation -> lateral move via RDP to a server -> credential dumping -> lateral move to a domain controller -> unusual process (`mimikatz.exe`) execution. The graph clearly showed the attack chain, accelerating containment.
2. Mapping the Phishing Campaign Infrastructure with Maltego
- Scenario: A surge in phishing emails targeting employees.
- Approach: Used Maltego transforms to gather OSINT: Extract sender domains/IPs -> resolve IPs -> find hosting providers/ASNs -> look up related domains/IPs via passive DNS -> check domain registration (WHOIS) for shared registrants/emails -> check threat intel feeds for IoCs.
- Visualization: The resulting graph revealed a cluster of newly registered domains sharing the same name server IP block and registrant email pattern, all resolving to the same hosting provider, with several already flagged as malicious. This identified the campaign’s infrastructure footprint for blocking and hunting internally.
3. Using MITRE ATT&CK with Graph Visualization
- Scenario: Proactively hunting for techniques associated with ransomware.
- Graph Approach: Enriching graph nodes (hosts, users) and edges (process executions, network connections) with associated MITRE ATT&CK Technique IDs (e.g., T1059 – Command and Scripting Interpreter, T1071 – Application Layer Protocol).
- Hunt: Visualized the graph filtered to show only nodes and edges related to techniques commonly used in ransomware deployment (e.g., T1486 – Data Encrypted for Impact combined with T1021 – Remote Services). Hunters looked for clusters where these techniques were connected, potentially indicating early-stage ransomware activity before encryption began.
Best Practices for Effective Entity-Based Threat Detection
- Start with Critical Events: Begin with critical data sources (AD, NetFlow, Core EDR) and high-impact threats (lateral movement, credential theft, C2).
- Prioritize Data Quality & Context: Ensure timestamps are accurate, entities are normalized (e.g., consistent hostnames), and enriched with threat intel and vulnerability data.
- Leverage Pre-Built Models & Intelligence: Utilize open-source graph models (like those based on MITRE ATT&CK) or commercial threat intelligence that provides graph-based context.
- Combine with Machine Learning: Use ML on graph features (e.g., node centrality, community detection) to identify anomalous structures or behaviors automatically.
- Define Clear Use Cases: Focus hunting efforts on specific questions: “Are there paths to our crown jewels?”, “Is there evidence of data staging?”, “Are there hosts beaconing to known bad IPs?”
- Iterate and Refine: Continuously update your graph model, queries, and visualizations based on new threats, intelligence, and lessons learned from investigations.
- Train Your Team: Invest in training for graph query languages (Cypher/Gremlin) and visualization tools. Foster a graph-thinking mindset.
Challenges & Limitations
- Data Volume & Complexity: Ingesting and processing massive datasets in real-time can be demanding. Graph databases require careful schema design and optimization for scale. Cloud-based solutions help mitigate this.
- Learning Curve: Mastering graph query languages and graph-based thinking takes time and dedicated effort.
- False Positives: Overly broad relationship mapping can generate noise. Tuning queries and focusing on high-fidelity relationships/indicators is crucial.
- Tool Integration: Integrating graph databases and visualization tools seamlessly into existing SIEM/SOC workflows can require significant engineering effort.
- Visual Clutter: Large, dense graphs can become overwhelming. Effective filtering, aggregation, and layout management are essential skills.
The Future of Graph-Driven Threat Hunting
Graph technology is rapidly evolving, promising even more powerful capabilities:
- AI-Powered Dynamic Analysis: Integrating graph neural networks (GNNs) to predict attack paths, identify novel threat patterns, and automatically score node/edge risk in real-time.
- Seamless SOAR Integration: Tighter coupling with SOAR platforms, allowing graph-based detections to automatically trigger complex, contextualized playbooks.
- Real-Time Streaming Graphs: Processing and analyzing relationships in data streams (like Kafka) for instantaneous threat detection and response.
- Unified Knowledge Graph: Creating holistic graphs that combine security data with business context (org charts, critical assets, supply chain) for truly risk-based prioritization.
- Enhanced Cloud & Hybrid Environment Visibility: Sophisticated graph models specifically designed to map complex cloud-native architectures, serverless functions, and hybrid cloud connections, making Cloud Security Posture Monitoring more proactive and contextual.
- Collaborative Threat Graphs: Shared, anonymized graph intelligence across organizations and sectors to combat evolving threats faster.
Conclusion: See the Connections, Stop the Threats
In the face of increasingly sophisticated and stealthy adversaries, traditional security tools often leave critical connections hidden. Entity-driven analytics cuts through the noise, transforming disconnected events into a clear map of relationships and potential threats. By explicitly modeling and visualizing your digital ecosystem – users, devices, processes, network flows, cloud resources – you empower threat hunters to proactively uncover attack paths, accelerate investigations, and understand complex campaigns at a glance.
The benefits are tangible: reduced dwell time, faster response, improved collaboration, and ultimately, a more resilient security posture. While challenges exist, the power of seeing the “why” and “how” behind security events makes entity-driven threat detection an essential capability for modern SOCs.
Ready to transform your threat hunting?
Want to try graph-based threat hunting? Start with Neo4j’s free tier and explore how analytics can transform your SOC! Explore resources like the MITRE ATT&CK knowledge base mapped to graphs and experiment with open-source tools like Maltego CTAS or CyGraph. Begin mapping your critical assets and their relationships – the insights you uncover might just prevent the next breach.
Employ ion Cloud Security to take care of your multi-cloud security posture.
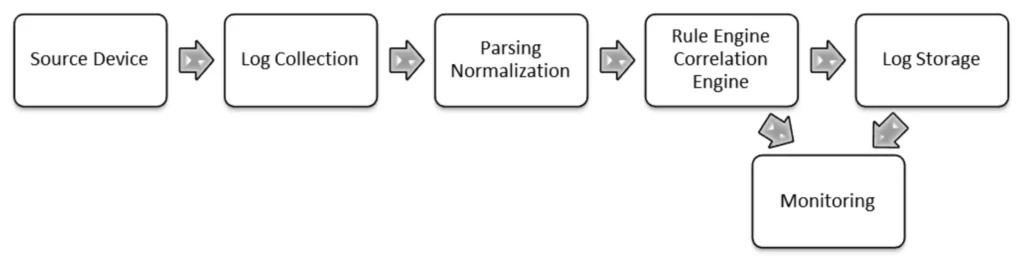
SIEM Workflow Visualization
Interactive diagram showing the complete Security Information and Event Management workflow with data flow, key components, and processes
SIEM Workflow Explained
Data Collection Phase
- Collects logs from various sources (network devices, servers, applications)
- Normalizes data into a common format for processing
- Enriches events with contextual information (asset data, user info)
- Stores data in optimized storage tiers for different access needs
Analysis & Detection Phase
- Correlates events across multiple sources to identify patterns
- Applies detection rules based on known threats and behaviors
- Utilizes machine learning for anomaly detection
- Prioritizes alerts based on risk scoring
Response & Reporting Phase
- Generates real-time alerts for security teams
- Integrates with SOAR for automated response workflows
- Provides dashboards for real-time monitoring
- Generates compliance reports for auditors
What is entity-driven analytics in threat detection?
Entity-driven analytics maps cloud threats as interconnected nodes (e.g., IPs, users) and edges (relationships like data transfers). Unlike SIEM logs, it visually exposes lateral movement, attack paths, and hidden malware infrastructure, enabling hunters to spot complex attack chains missed by traditional tools.
How does entity analysis improve threat detection?
Entity analysis uncovers anomalous relationships (e.g., an employee accessing unrelated servers) by connecting Indicators of Compromise (IoCs). It detects stealthy threats like APTs 60% faster by revealing command-and-control links and data exfiltration paths that log-based systems ignore.
What are the best graph databases for threat detection?
Top options include:
- Neo4j (Cypher queries for intuitive threat mapping).
- TigerGraph (real-time analytics for large-scale data).
- Azure Cosmos DB (cloud scalability).
Open-source tools like Apache TinkerPop suit budget-constrained teams.
How do you model attack paths using graph databases?
Follow these three steps:
- Define nodes (devices, users, files).
- Map edges (relationships like "accessed" or "copied").
- Query patterns (e.g., "Find all paths from a phishing email to sensitive data").
Tools like Maltego automate this via drag-and-drop visualizations.
How to query a graph database for threat intelligence?
Use query languages like Cypher (Neo4j) or Gremlin to hunt threats. Example: MATCH (src:IP)-[:SENT_DATA]->(dst:Domain{malicious:true}) RETURN src, dst This identifies suspicious IPs communicating with malicious domains.
Can graph visualization detect advanced persistent threats (APTs)?
Yes. For example, Mandiant uncovered APT29 by linking nodes—phishing emails, compromised hosts, and exfiltrated data—into a single graph. This exposed the attack lifecycle, from initial access to data theft, in hours instead of weeks.
What’s a real-world example of entity-driven threat detection?
A Fortune 500 SOC used Neo4j to visualize DNS requests, spotting a command-and-control (C2) server linked to 50+ internal devices. The analysis revealed a supply chain attack originating from a vendor’s compromised software update.
What are the drawbacks of entity-based threat detection?
Key challenges include high computational costs for large datasets, false positives from overly complex mappings, and a steep learning curve for query languages. Integration with existing SIEM tools can also be resource-intensive.
What challenges arise when using entity analytics in a SOC?
SOC teams often struggle with data normalization (structuring disparate logs into nodes/edges) and scalability during peak incidents. Specialized training is essential to avoid misinterpretation of dense visualizations.
How will AI enhance entity-driven threat detection?
AI will automate anomaly detection in relationship graphs, predict attack paths via machine learning models, and integrate with SOAR platforms for real-time response. For example, AI can flag zero-day exploits by learning normal graph patterns.
What future trends are emerging in entity-based cloud security analytics?
Expect:
- Automated graph generation from raw logs using NLP.
- Cross-platform graphs merging cloud, endpoint, and network data.
- Predictive graph analytics simulating attacker behavior (e.g., using MITRE ATT&CK framework).
What are the advantages of entity-based threat detection over SIEM?
Graphs excel at revealing contextual relationships (e.g., "why" an alert matters), while SIEM focuses on "what" happened. This reduces alert fatigue by 40% and accelerates incident triage—proven in ransomware cases where graphs mapped encryption paths across departments.
Can entity databases integrate with existing security tools?
Yes. APIs connect tools like Splunk or Elasticsearch to graph databases. Ingest logs via ETL pipelines, then visualize links in platforms like Maltego or BloodHound for Active Directory analysis.